
Selected Analytics Projects
Explore inventory planning and data quality demonstrations using public transaction data. Each project explains the business question, the approach, the findings, and their limitations. These examples illustrate NuMetriq’s analytical approach; they are not client case studies.
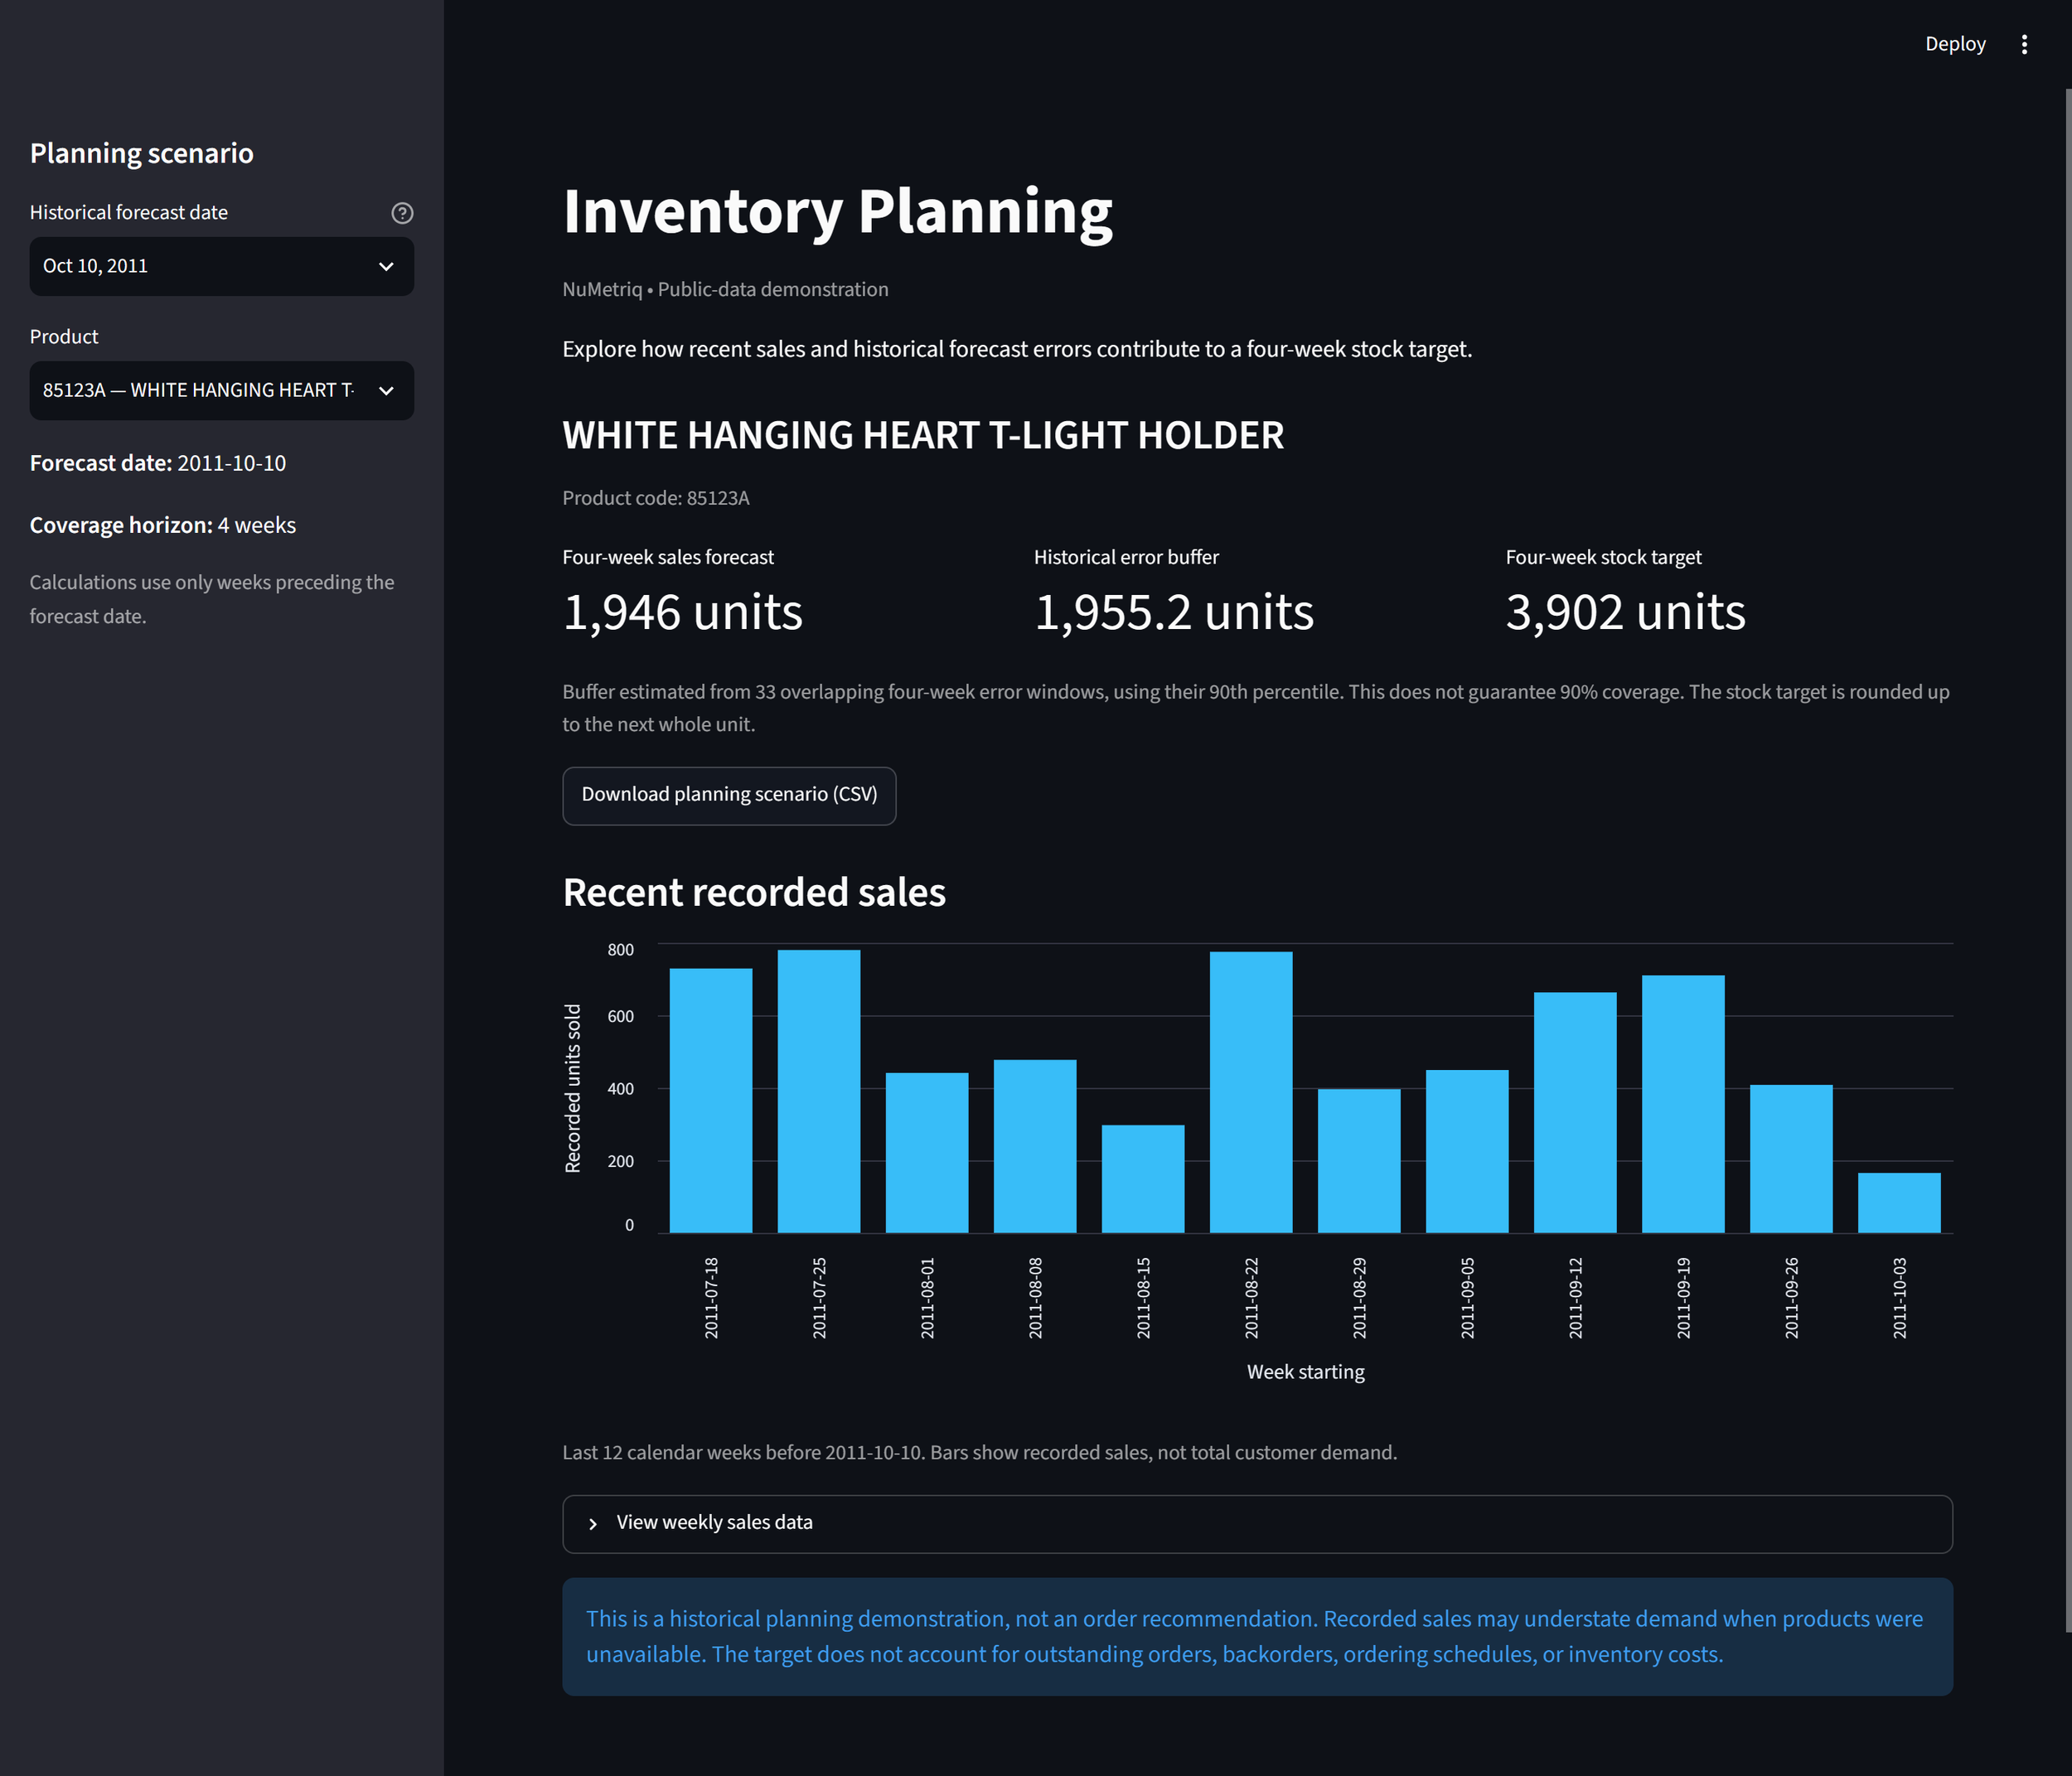
Inventory Planning: Forecasts and Shock Targets
The question
How does adding a buffer for forecast uncertainty change the balance between covering recorded sales and setting higher stock targets?
The approach
Using the Online Retail II dataset, this project builds weekly product sales histories and forecasts the next four weeks from recent sales. It adds an uncertainty buffer based on historical forecast errors available at each planning date, then compares the resulting stock targets with subsequent recorded sales.
What the analysis showed
Across 15,797 evaluated product-and-date combinations, adding the buffer increased the share of four-week periods whose recorded sales fit within the target from 56.1% to 83.5%. Average stock targets also rose from approximately 138 to 250 units per product. This illustrates the trade-off between greater sales coverage and higher planned stock.
What you can explore
The dashboard supports product and historical-date selection, displays sales history, separates the forecast from its uncertainty buffer, and provides downloadable planning scenarios.
Limits
Recorded sales may understate demand when products are unavailable. This analysis does not simulate replenishment or measure actual stockouts, inventory costs, or savings. Reorder recommendations would also require current stock, outstanding orders, supplier lead times, and ordering constraints.
Data Quality Assessment: From Flags to Investigation
The question
Which records need closer review before using transaction data for customer analysis, product reporting, or planning?
The approach
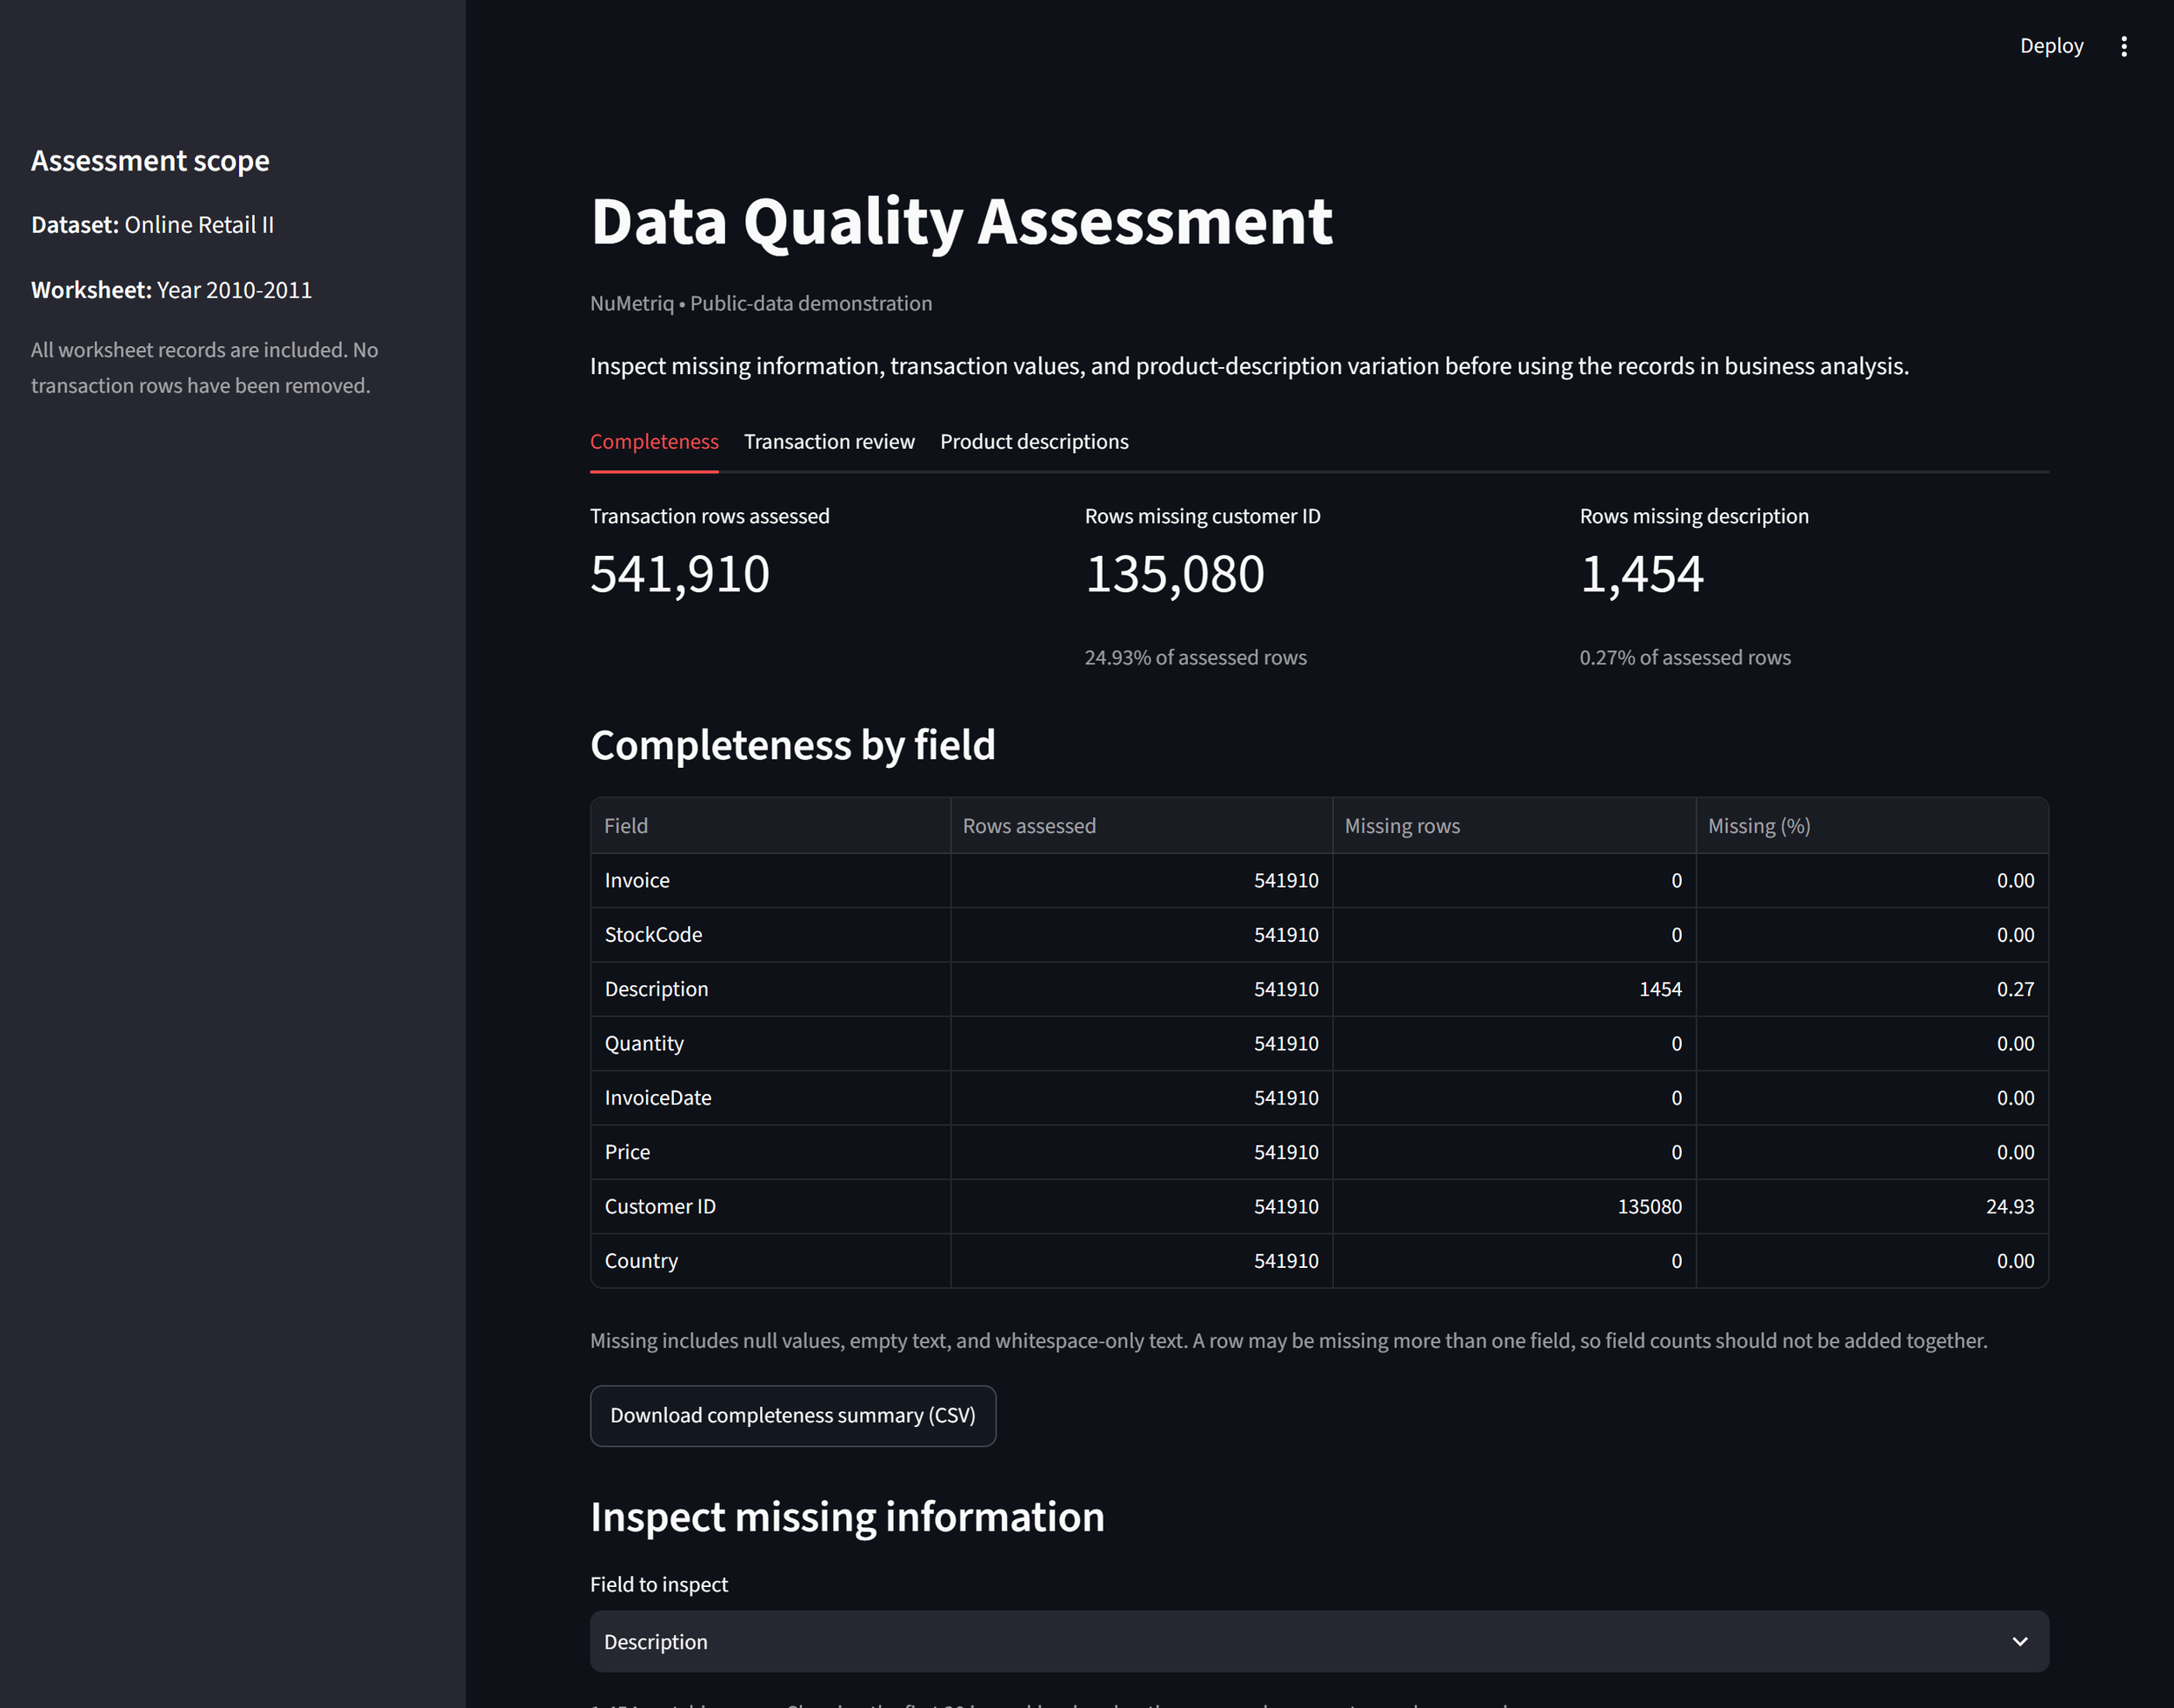
This project examines 541,910 transaction rows from the 2010–2011 worksheet of the Online Retail II dataset. It checks missing information, flags unusual quantities and prices, and compares product descriptions after standardizing capitalization and spacing.
What the analysis showed
Customer IDs were missing from 24.93% of records, limiting how fully customer-level analysis can represent the sales history.
The transaction checks flagged 11,805 distinct rows for review. These flags identify unusual values, including negative quantities and zero prices; they do not establish that the records are incorrect.
Across all records, 643 product codes had multiple descriptions. Restricting the assessment to positive-price records reduced that count to 212. Inspection of selected products showed that stock adjustments and operational notes accounted for some of the variation.
What you can explore
The dashboard presents completeness summaries, transaction flags, and description comparisons, with record examples and downloadable summaries that explain the assessment definitions and limitations.
Limits
Returns, adjustments, and description changes can reflect legitimate business activity. The assessment identifies questions for investigation; confirming errors and choosing corrections requires knowledge of the business and its recordkeeping practices.
Have a decision you’re unsure about?
Have a similar question about your inventory, product margins, or data quality? Tell us what you’re trying to decide, and we’ll discuss what your records could help answer.